Digital Design for Manufacturing is the process of communicating to a machine what you want from it. You and the machine have a language in common–the software you are using to do the design in. This software could be focused on two dimensional design, such as Photoshop, Paint, Illustrator, or Inkscape for creating raster and vector images to use with processes such as vinyl cutting, laser engraving, or CNC routing. Or, the software could be three dimensional, such as TinkerCAD, Blender, or Fusion, for use with processes such as 3D printing and CNC routing.
A process is something that a tool does. The process is, for example, 3D printing, CNC routing, or vinyl cutting.
We will start by understanding what an image is, the fundamental types of image format, and how this format changes the product created by the tool. Later, we will get into color, things to watch out for with specific processes, and tips and tricks for using (some of) the software discussed here.
¶ What is an image?
To a person, an image is a visual representation of something.
To a computer, an image is data. It is stored with some information that tells the computer how to interpret and display the data.
Computers store and interpret images in two main ways: raster images and vector images.
| Raster Images | Vector Images |
|---|---|
| Raster images are created by defining what a pixel looks like, and are stored and interpreted as lines of pixels. Pixel properties: color, luminance Image properties: number of pixels, dimensions, DPI, color depth Display properties: pixel size, DPI, color depth |
Vector images are created defining a path and then applying an effect along that path. They are stored as a description that computers know how to show you as an image. Image properties: path, path effect, dimensions |
| Common file types: .jpg, .png, .bmp | Common file types: .svg, .ai, .dxf . SVG stands for ‘scalable vector graphic’ |
Example: Pointillism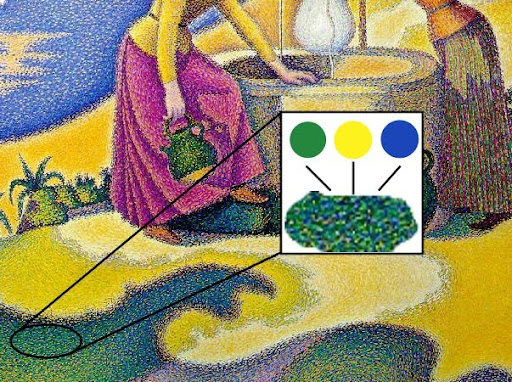
|
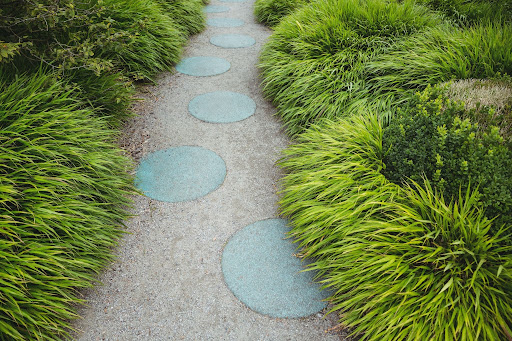
Example: Garden walkway
|
If you’re old enough to remember when the internet was slow, you may recall images loading line by line or getting stuck halfway through loading. All of those were raster images–it was possible to display half an image because each pixel is defined, so if you’ve got 10 of 20 pixels, you can display those 10 pixels. The information that accompanies the image tells the computer that it’s supposed to have 20 pixels instead of 10, so it knows to leave space for the remaining pixels that it doesn’t have yet.
If a computer only receives part of a vector image, the image is broken. The computer can’t render the vector image because it doesn’t have the entire description of the image and thus can’t figure out what it’s supposed to look like. Fortunately, vector images are described using text, which loads super fast so it’s rare that a vector image breaks in that way.
¶ Resolution
Resolution is the level of detail in an image. It is often measured in ppi (pixels per inch) or dpi (dots per inch) because it is tied to the area of the image and how much data there is to describe that area.
If the area of an image is changed but the amount of data to describe that area stays the same, the image will look pixelated, blurry, blocky, or only show part of the image.
| Raster Images | Vector Images |
|---|---|
| Because raster images are composed of rows of pixels, changing the size (or scale) of the image also changes the resolution of the image. | Because vector images are a description of how the image should look, changing the scale of the image does not change the resolution of the image. |
Example: by changing the number of dots (or pixels) in a fixed area, the amount of detail that can be displayed changes.

|
Example: the description of a star shaped path with pink fill looks like this. id="starpath" style="fill:#e6308a;stroke-width:5;stroke-linecap:round;stroke-linejoin:bevel;stroke-miterlimit:10" inkscape:transform-center-x="5.9421415" inkscape:transform-center-y="0.60164079" d="M 107.28452,104.79917 62.416038,98.415401 31.720617,131.75793 23.926816,87.112776 -17.26922,68.223104 22.782427,47.014647 28.017297,1.9976594 60.564378,33.535266 104.99574,24.602909 85.059296,65.302678 Z" |
¶ So how do I get a raster image?
Photograph, or painting in a program such as Photoshop, GIMP, or MS Paint.
We’ll talk more about working with raster images later. For now we will move onto Vector Images and what goes into defining a vector image.
¶ Vectors
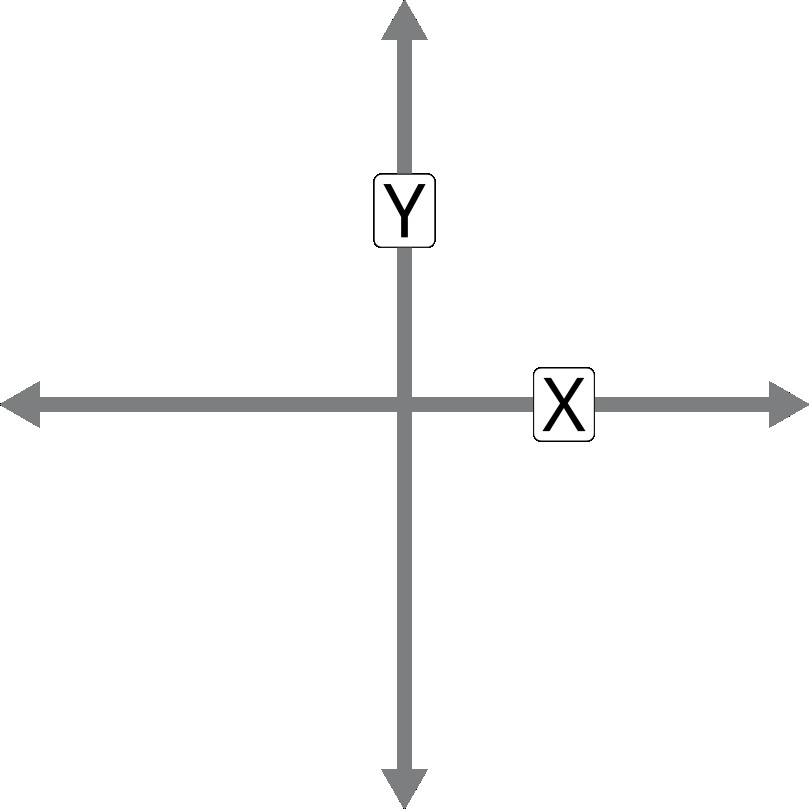
Vector images are drawn on a canvas that is defined by an X and Y coordinate system. Drawing software rarely explicitly labels the axis in the way CAD software does, but X is typically horizontal, left to right, or refers to the width of something. Y is typically vertical, up to down or front to back, or refers to the height of something. X and Y are always perpendicular or 90 degrees to each other. It does not necessarily have any units, such as millimeters or inches, associated with it although many vector graphics softwares support having defined units.
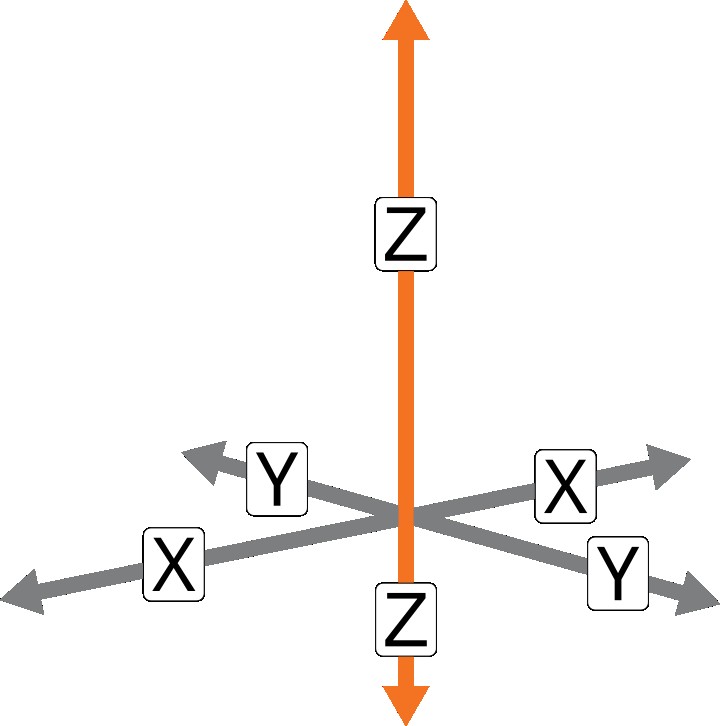
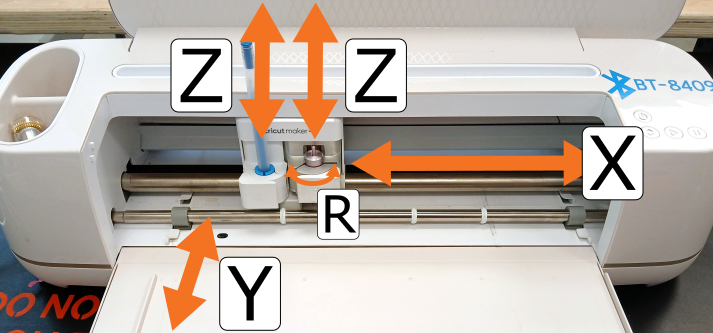
You might also see Z and R! Z brings X and Y into the 3rd dimension and is always perpendicular to X and Y. R typically refers to a rotational axis in a machine rather than a dimension, and is measured in degrees of rotation.
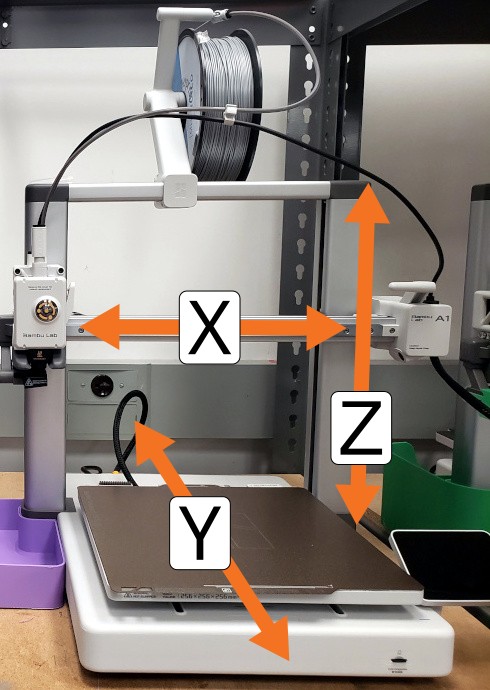
A 3D printer has a 4th axis of motion called E. E stands for extrusion, and controls the flow of filament through the extruder. E is similar to R.
We talked earlier about paths. Vector is another name for path, although to be pedantic a vector just contains location and direction information and does not have any path effect information. These can also be called Beziers or Bezier Curves. All of these terms are used interchangeably.
¶ Paths
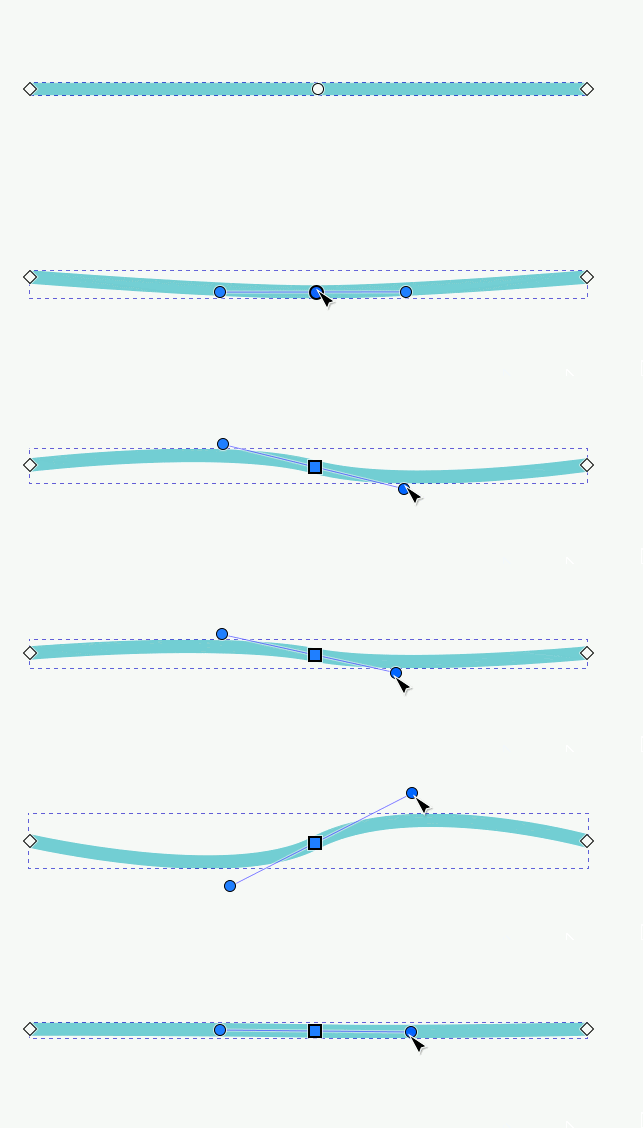
A path is defined by two or more nodes, each with an associated direction or angle. The direction associated with a node describes how the line or path enters and exits the node. In most vector drawing softwares, the angle of each node is defined using handles. Handles, or control handles, are imaginary lines that come out of a node that show you what angle the vector is leaving the node at. The length of the handle controls how strongly that angle is enforced.
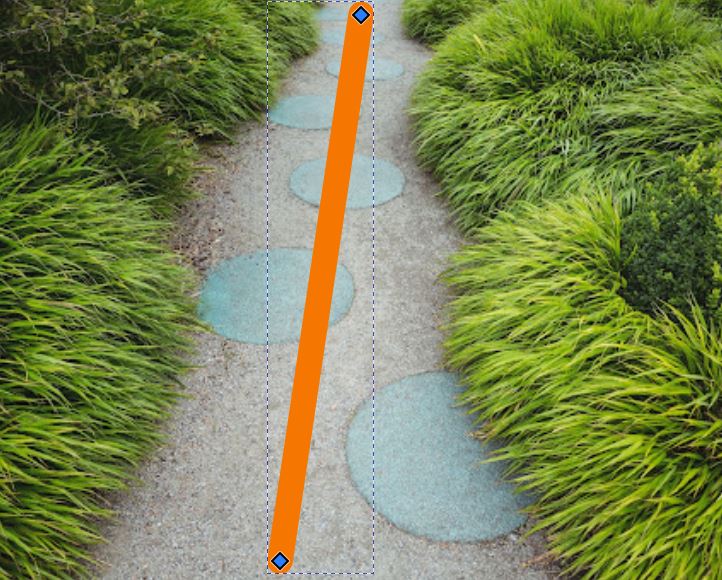
The garden path example from earlier now has a digital path superimposed. The digital path has two nodes representing the beginning and end of the paths. The digital path is perfectly straight although it could be curved by adjusting the angles associated with the nodes. The digital path does not represent the gentle squiggle of the garden path well.
In that same example, two more nodes have been added to the digital path. This lets us curve it to match the garden path more closely.
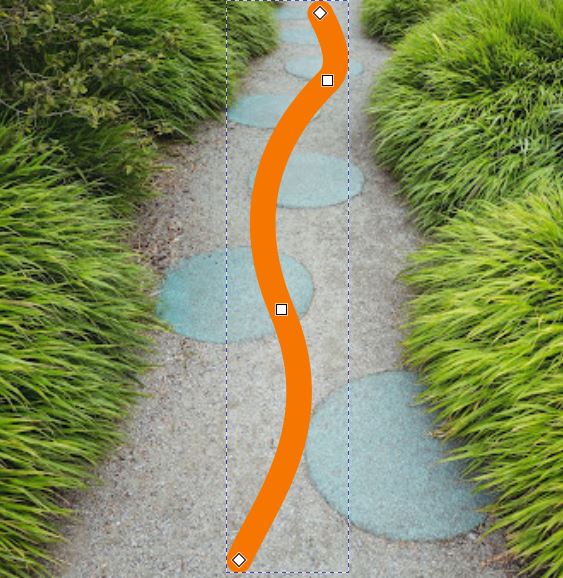
Tip: When working with nodes, the shape of the node as displayed by the software does have meaning. Squares, diamonds, and triangles are common shapes. These shapes tell you whether the node is set to corner, smooth, or symmetric which all control how vectors enter and exit the node. The same is true for the shapes of the handles, often squares and circles. Unfortunately, vector drawing softwares do not agree with each other what shape means what, so you’ll have to figure it out for each program as you use it.
Here are Inkscape's four node types: corner (diamond), smooth (square), symmetrical (square node with handles), and autosmooth (circle).

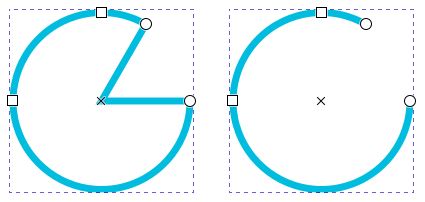
There are also two types of paths. Open and closed. Closed paths do not have a beginning or end: they are a loop with no way out. Open paths are just that–open. When drawing a path, most software will let you close the path by placing the last node on top of the first one. If that isn’t a feature or something goes wrong with the process, selecting both nodes and using a tool to join them usually does the trick.
Okay, let’s come back to the real world for a second. Why do we want vector graphics for use with machines?
Machines move a tool along a path with some path effects applied. They use an X and Y coordinate system. They move the tool between points, equivalent to nodes, and apply path effects like speed, temperature, and power. This makes vectors ideal for describing how a machine moves. Humans aren't very good at defining vectors numerically but we’re pretty good at drawing them. Vector drawing software and CAD software are the translators between our drawings and the underlying numerical definitions that the machine uses.
The next step in the process is often a software that is specific to the machine to translate the vectors into the specific language the machine understands--often but not always a language called gcode.
[pair a vector in a drawing program with a path in vcarve with the final product]
But we’re not there yet, we’re still building paths and exploring the drawing software because we've only just gotten to the part that trips a lot of people up. Vector graphics programs don’t use only vectors!
¶ Objects
Vector graphics programs use objects. Objects can be a bunch of different types of things. These things include paths, polygons and other shapes, text, and raster images. Because they are all objects, they can all be manipulated the same way. Common manipulations are
- Transformations: translation (moving), rotating, mirroring, scaling, and skewing
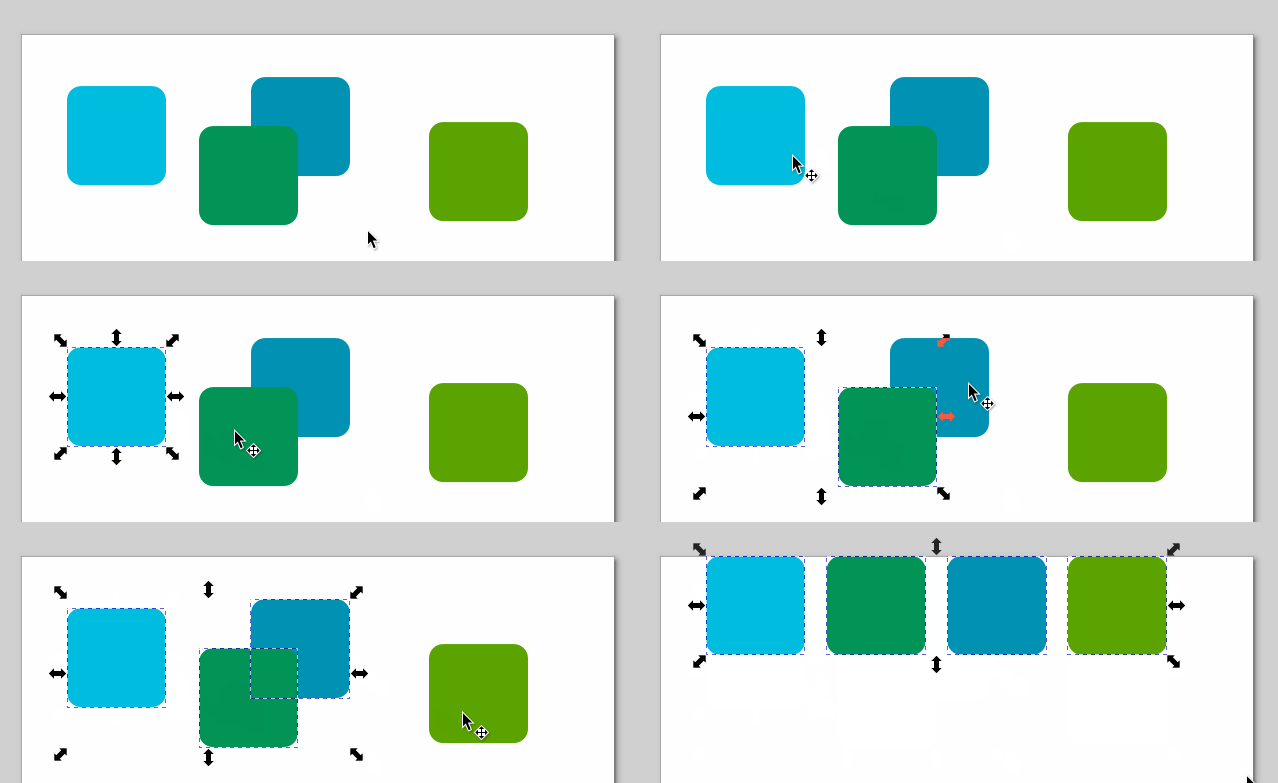
- Aligning- any manipulation that lines up a part of an object with a part of another object. For example, aligning all of the left sides of the selected objects.
- Distributing- creating equal spaces between selected objects. Also used for positioning objects along a line, circle, or other path, or moving them into a grid.
If you want to manipulate any property associated with the type of object, then you need to use a tool specific to that type on the object. For example, use the text tool to change the words, font, weight, and kerning of a text object. Shape objects don’t have those properties, but they do have properties like number of sides and corner radius.
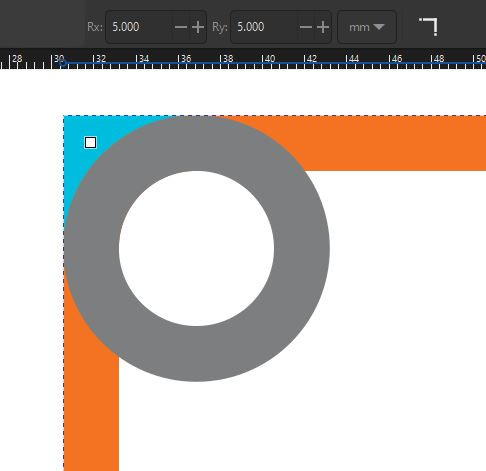
Corner radius is a method of rounding a corner by setting an arc to intersect with the edges of the corner, and dropping the corner that is outside of the arc. In the following image, the circle represents the arc, the orange lines represent the shape to be rounded, and the blue represents the area removed. In three dimensions, a corner radius is called a fillet or a face blend. We’ll talk more about 3 dimensional things later. For now, just know that a lot of 2D concepts extend into the third dimension.
Because objects are not (always) paths, they need to be converted to paths before a tool and its software can understand them. This is true even though objects can be saved in svg and related formats and svg is a preferred import format for many software tools. Vector drawing programs provide tools to do this conversion. Note that when the object -> path conversion is performed, the ability to edit the type of object it once was with type specific tools goes away. For example, after a text object is converted to a path, you cannot change what it says, the font, etc. But you can change individual nodes in each letter, should you want to do that. Once something is converted to a path, it cannot be un-pathed except through immediate use of undo (Ctrl z).
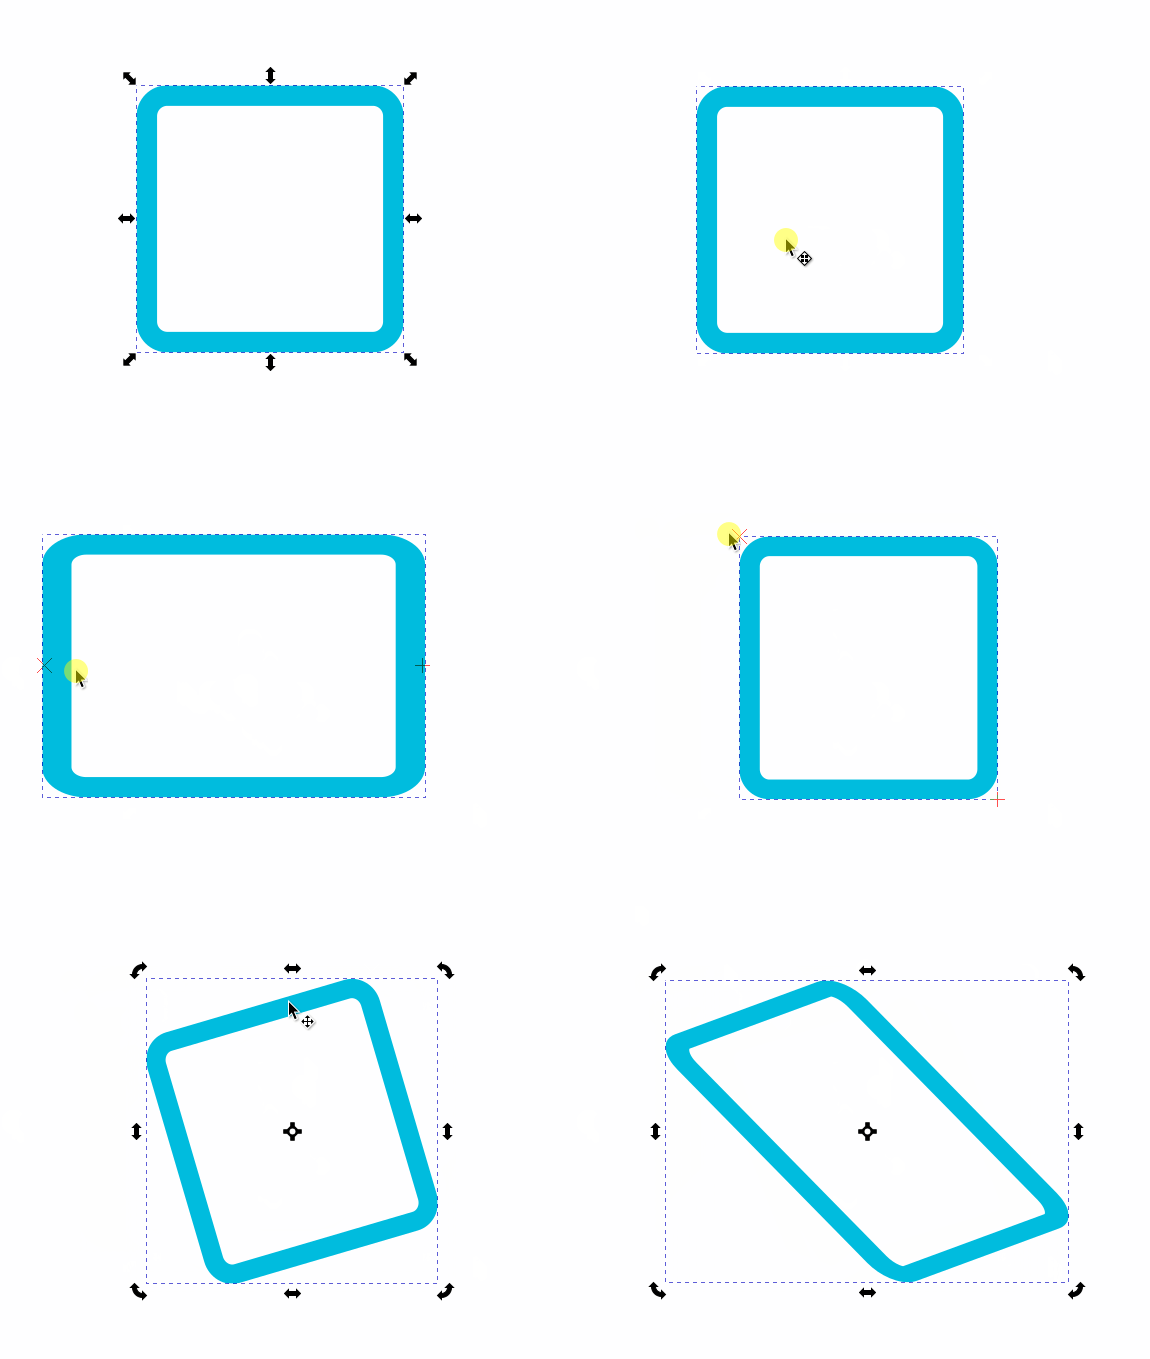
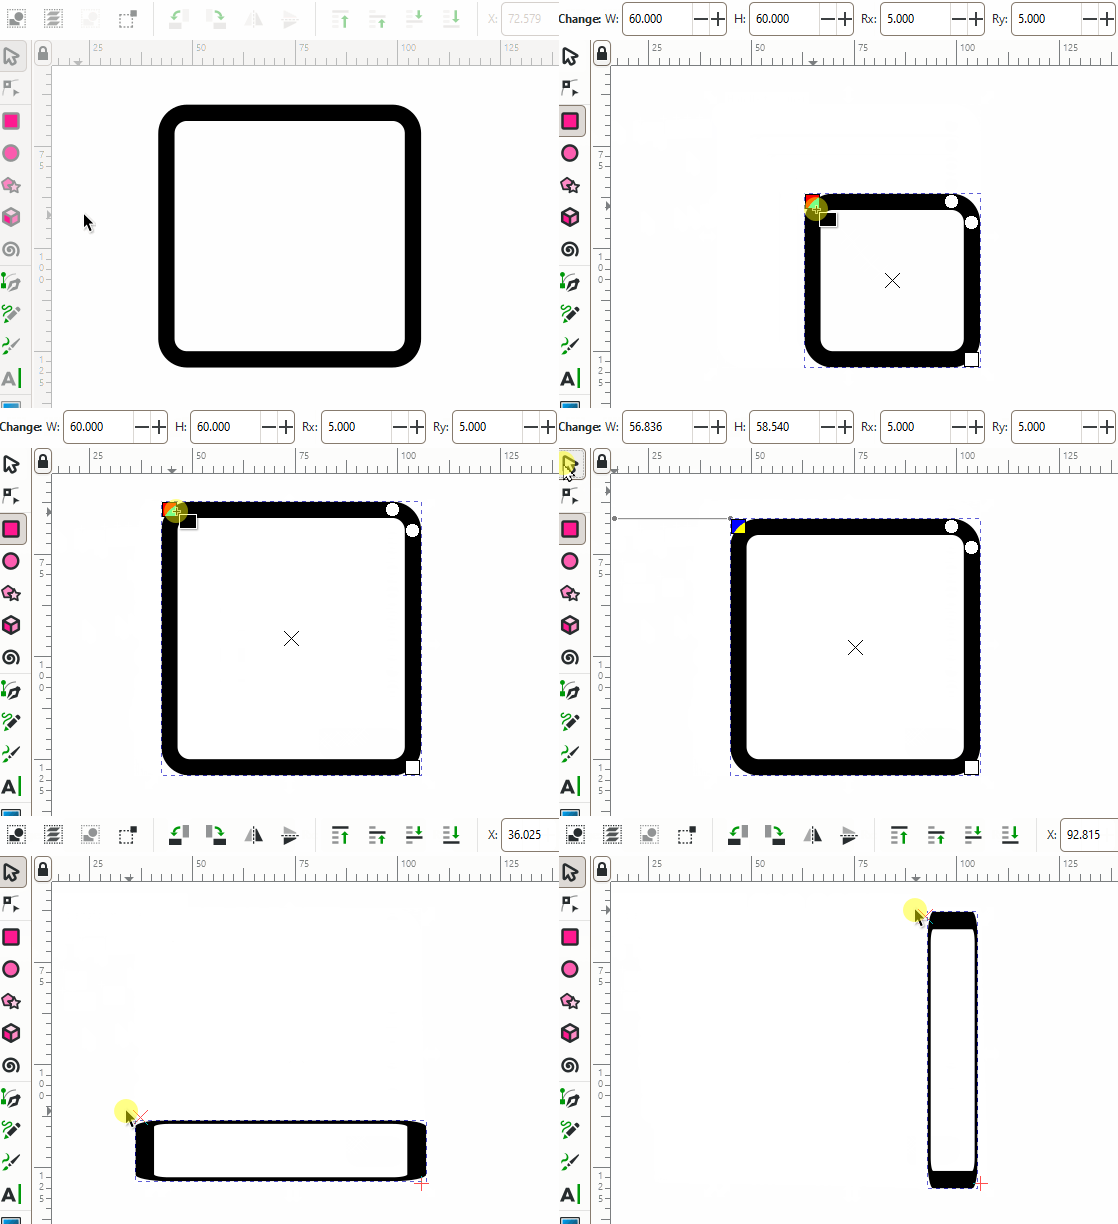
It is really really tempting to resize shape objects using transformation tools (such as scale). However, if you want consistent stroke widths, corner radius, etc, it is best to resize the shape using the shape's tool. Here a square with a 5px corner radius is resized using the rectangle shape tool, then resized using the transformation tool. Notice that when the transformation tool is used, the thickness of the line changes, as do the corner radius.
¶ Path Effects
Path effect is a general name for anything that exists on, follows, or has an effect over a path. The most common, most basic path effect is called stroke. Stroke has paint and style properties. The paint property defines things like the color and opacity. The style property defines things like the width, whether the stroke has dashes or dots, markers at the ends or along its length, and how it joins with other paths.
In the real world, stroke is roughly equivalent to painting over a drawing, where the pencil sketch is the path and the path effect is the shape of the brush and the color of the paint on the brush.
[a pencil sketch, literally just a line. Then, use a paint brush and paint to paint over that line]
In the machine world, path effects are defined by things like the size and shape of a router bit, the power and speed used by a laser cutter, and the type of stitch and thread color used in embroidery.
A closed path unlocks another effect called fill. Fill defines what the area inside a closed path looks like. This is most similar to the paint property that strokes have. Open paths can also have fill but it may behave weirdly.
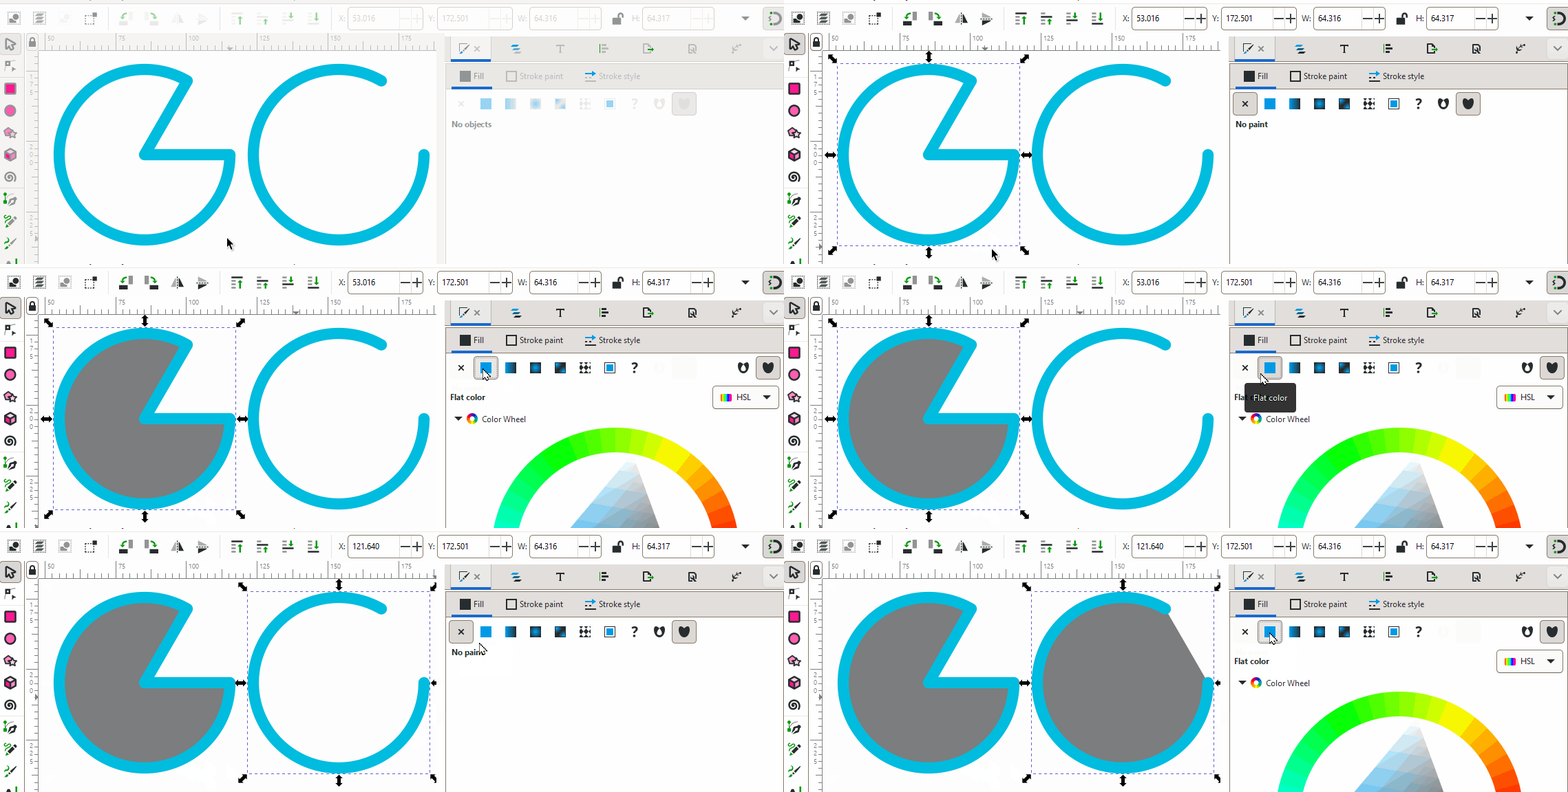
There is no consensus between tool softwares on how to interpret path effects and fill. Some tool softwares may ignore a stroke entirely and just use the underlying path while others may interpret the edges of the stroke as where to move the tool head while others may interpret the space between the edges of the stroke as an area to be filled.
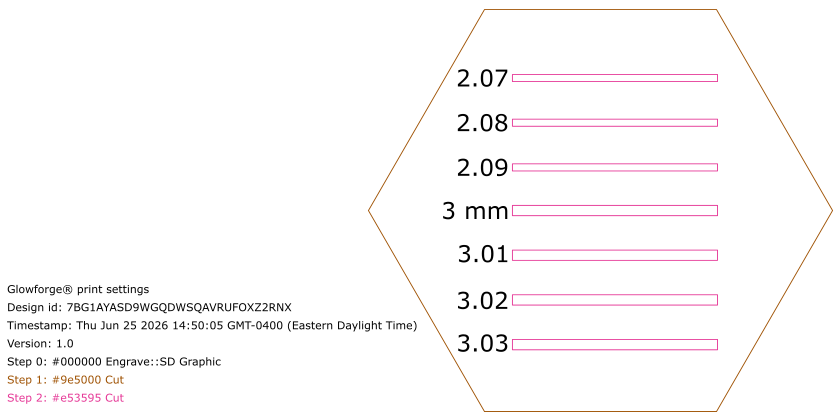
Some tool softwares may interpret the color of the stroke as a particular process. For example, laser cutter software will often interpret colors as power or speed settings and every path in a design with a stroke of a particular color will get the same settings. There is no consensus on what colors mean what; often the specific setting is left up to the user to define. Likewise, many tool software programs ignore the fill and its color because the "fill" is just the surface of the material that you've chosen–except for digital embroidery and printed processes like Direct to Garment and Dye Sublimation.
¶ Common Design Software
| Raster | Vector | CAD |
|---|---|---|
| Photoshop (Adobe product, available in the OW computer lab) | Illustrator (Adobe product, available in the OW computer lab) | AutoCAD 360, Fusion, Rhino |
| GIMP (GNU Image Manipulation Program, free download) | Inkscape (free download) | TinkerCAD, FreeCAD, and others |